Unit 1 Project – Functions, Characteristics and Transformations DUE DATE: Jan 20
You are responsible for summarizing what you learned about functions to present to a student who transferred to the school 2 weeks after the semester began. Your work should be clear and complete so that you can convince them that you are proficient with functions.
Your summary should include the following:
Part 1: Linear Function
1. State the equation of the parent linear function. (1 point)
2. Sketch this function. Be sure to plot at least 3 points. (2 points)
3. State the domain of the function. (1 point)
Part 2: Absolute Value Function
1. Make a table of values for g(x)=2|x|, using x = -4, -2, 0, 2 and 4. (5 points)
2. Sketch both g(x)=2|x| and f(x) = |x| on the same graph. Be sure to identify which graph is which. (2 points)
3. Identify the transformation that took place from f(x) to g(x). (1 point)
4. Identify the extrema of g(x) and identify whether it is a maximum or minimum. (2 points)
5. Identify the interval of increase or decrease. Also, be sure to identify which one it is (increase or decrease). (2 points)
Part 3: Quadratic Function
1. Sketch f(x) = x² and h(x) = x² + 7 on the same graph. Be sure to identify which graph is which. (2 points)
2. Identify the transformation that took place from f(x) to h(x). (1 point)
3. Identify the domain and range of h(x). (2 points)
4. Identify the y-intercept of h(x). (1 point)
5. Identify the vertical line of symmetry, if it exists. (1 point)
Part 4: Cubic Function
1. Sketch g(x) = -x³. (1 point)
2. Identify the transformation that took place from the parent cubic function to g(x). (1 point)
3. Identify the interval of increase or decrease. Also, be sure to identify which one it is (increase or decrease). (2 points)
4. Identify the range of g(x). (1 point)
Part 5: Square Root Function
1. Make a table of values for h(x) = √x – 3, using x = 0, 1, 4 and 9. (4 points)
2. Sketch h(x) = √x – 3 using these values. (2 points)
3. Identify the x-intercept and y-intercept of h(x). (2 points)
4. Identify the domain and range of h(x). (2 points)
5. Identify the extrema, if any. Also, be sure to identify whether it is a maximum or minimum. (2 points)
Part 6: Rational Function
1. Identify the equation of the parent rational function. (1 point)
2. Sketch this function. (2 points)
3. State which value of x is not included in the domain and explain why. (2 points)
*Be sure that your work is clear, complete and convincing.
Part 7: Using what you know
Based on the graph below on iPod sales, answer the following questions.
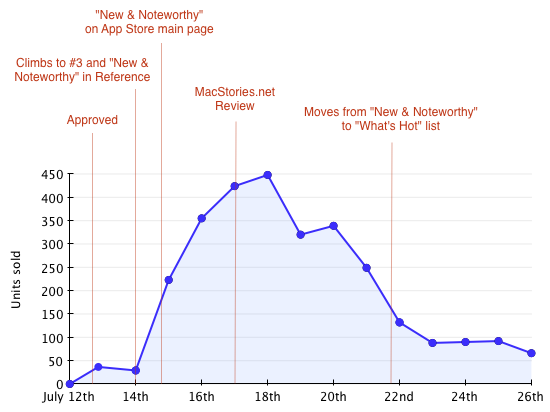
1. What is the maximum? (1 point)
2. What is an interval of increase? (1 point)
3. What is the range? (1 point)
4. Which one of the following statements is not true? Explain why. (2 points)
a. The graph has a minimum on July 12.
b. The graph is decreasing from July 20th to July 23rd.
c. The x-intercept and the y-intercept are the same point.
d. The graph is decreasing from July 19th to July 20th.